
LEARNING / DEMONSTRATION
Regression explorer
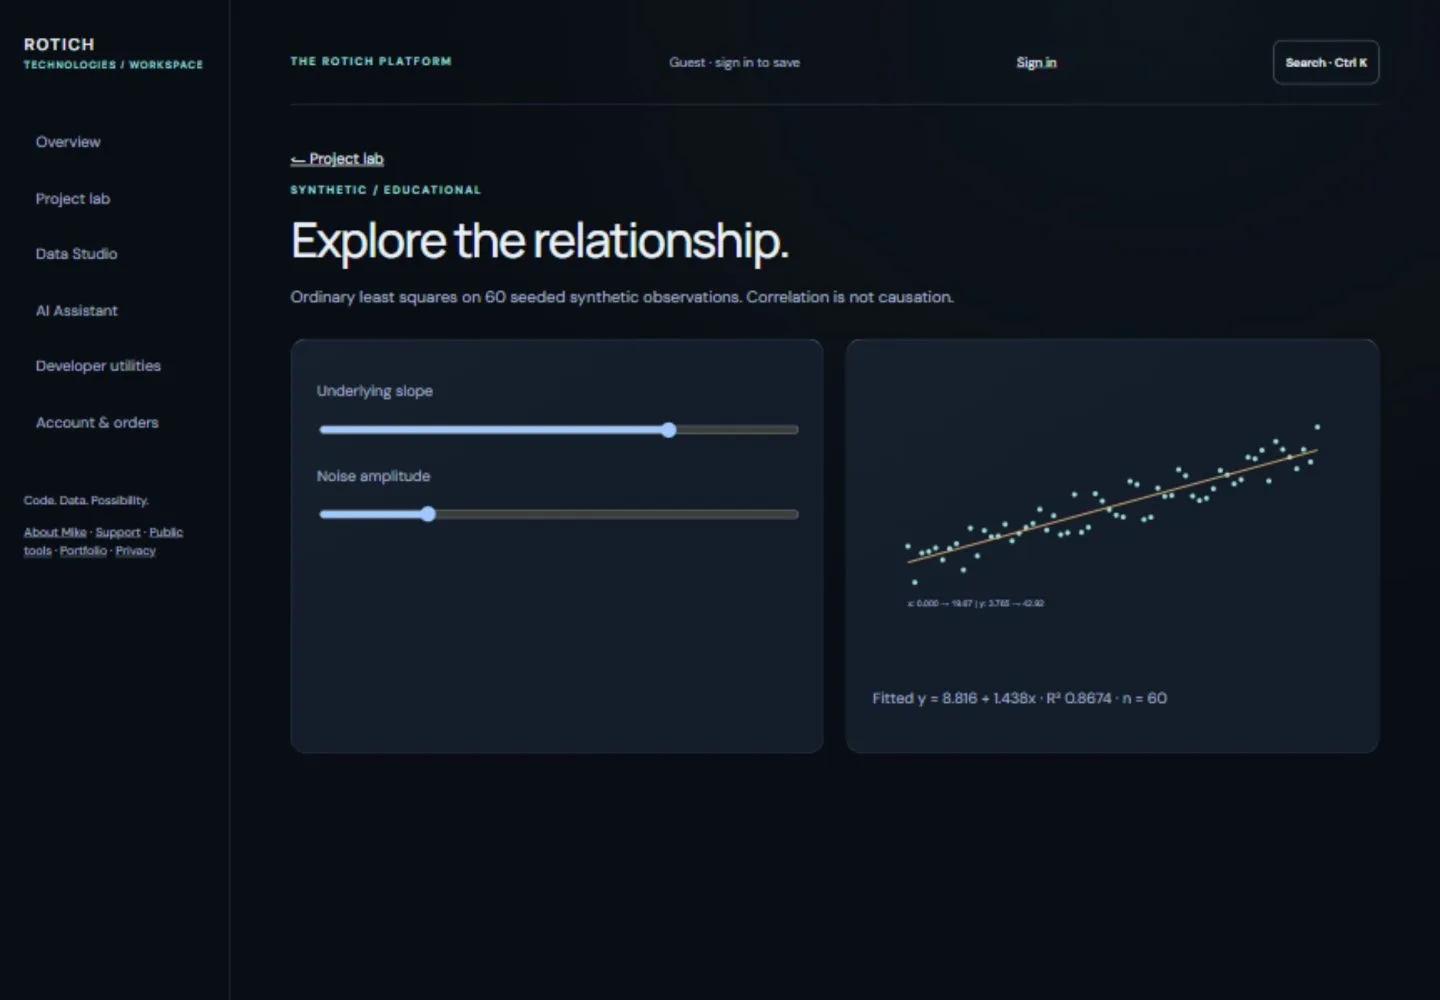
Change a synthetic dataset and inspect an ordinary least-squares fit.
The problem
A fitted line is easier to interpret when the relationship and noise can be changed independently.
Implementation
The demonstration generates synthetic points and computes a best-fitting line. Controls let the visitor explore the effect of noise and trend.
Architecture
- Controls
- synthetic observations
- least-squares calculation
- canvas plot.
Technical challenge
A visual correlation can be persuasive. The explanation keeps association separate from causation.
Outcome & limitations
A working interactive demonstration for learning about linear relationships. It does not make predictions about real customers or businesses.
My project
This is part of my ROTICH TECHNOLOGIES initiative. The implementation described above is available to inspect through the working example; it is not a claim of client delivery or sole authorship.
Technology: Canvas. No public source repository is currently linked.
← All projects