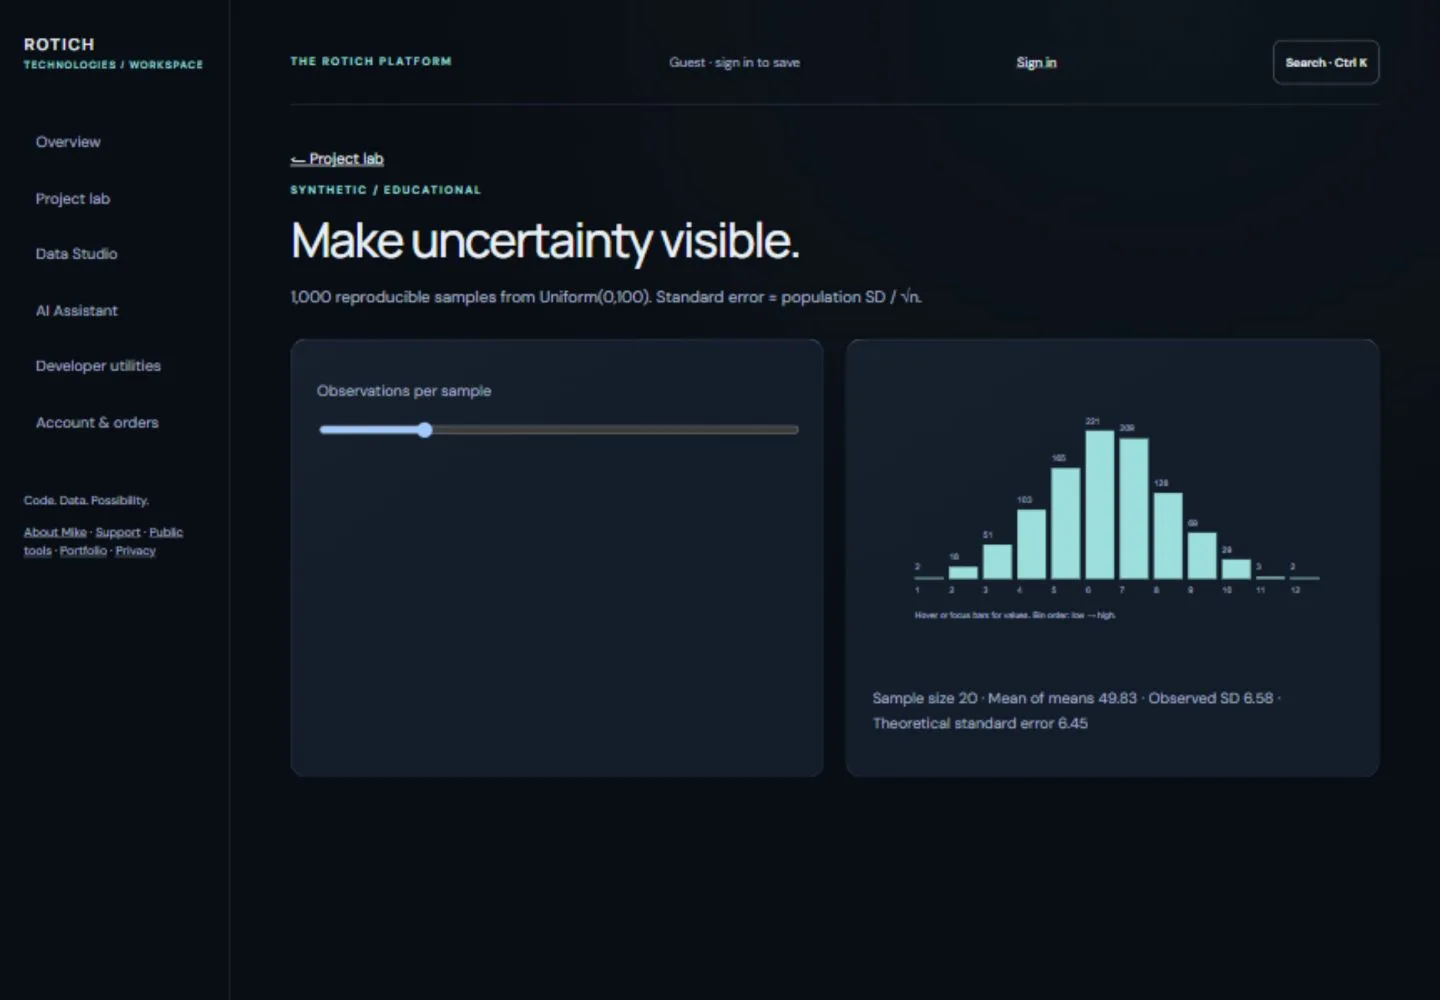
Sampling variation is hard to understand from a single numerical summary.
Implementation
Generate repeated synthetic samples and compare their means. The visual result supports discussion of variability and sample size.
Architecture
Data flow
Sample controls
simulation
sample means
distribution display.
Technical challenge
A simulation illustrates a model; it does not prove that the model applies to a particular real dataset.
Outcome & limitations
An interactive teaching tool using synthetic data. Random runs can differ.
My project
This is part of my ROTICH TECHNOLOGIES initiative. The implementation described above is available to inspect through the working example; it is not a claim of client delivery or sole authorship.
Technology: Canvas. No public source repository is currently linked.